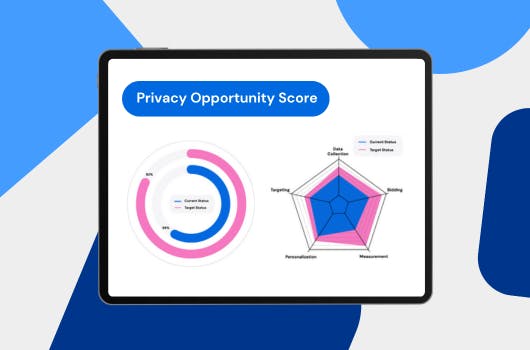
In a lot of exploratory queries, you want to know not only how many rows had a certain value but what percentage of all rows in the table this count value represents.
For example, I have a table with 240 customers’ records. Of these customers, 115 are located in Australia, 55 in the US, 36 in China and 34 in Germany. To find these aggregate numbers is easy enough with a GROUP BY query like this:
But what if I also want to know what percentage of my customers are from each country? What percentage of my customers are within Australia? To do this, we can tweak the above query a little by introducing a window function.
A window function (also called an analytic function) calculates aggregate values over a group of rows. Unlike aggregate functions (GROUP BY), which return a single aggregate value for a group of rows, window functions return a single value for each row by computing the function over a group of input rows. You can read more about them in the BigQuery docs.
The result of this query will be a table with 4 fields:
- Each country
- Number of customers in that country
- Total number of customers in the table (will be the same for each row)
- Percentage of all customers that are in that country

Please note that the second and third fields are not necessary for this query to work. You may remove them if you only want to see the country names and percentages.