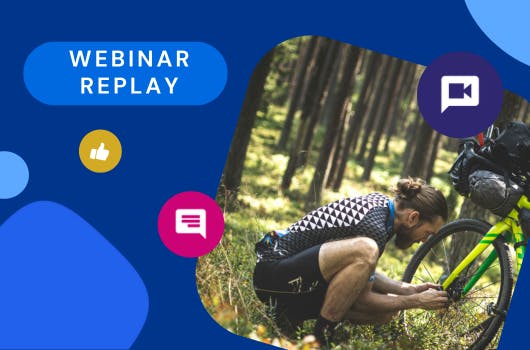
Google App + Web allows you to combine app and web data for unified reporting and analysis and we have been trying it out. We liked the concept but found some things that are not quite working. Since it’s a beta product, we have decided to list all the limitations we found and update the list as the product evolves. We will be able to look back and see how it progresses to a mature product.
Limits for Custom Parameters and User Properties are very low
Currently, App + Web is limited to 100 Custom Parameters per property (50 text parameters and 50 numeric parameters), and each Custom Parameter cannot be longer than 100 characters. For User Properties, the length limit is even smaller (36 characters).
If we want to use hashed email address as a user identifier, it has to be SHA-256 hashed and results in a 64 characters string, thus it cannot be set as a User Property. If we set it as a Custom Parameter, it has to be added to every event, each will take up one parameter of the 50 text Custom Parameter count.
Another example is Google recommended events for all apps and Retail/Ecommerce apps. However, when you add all the recommended Custom Parameters together, it exceeds the 50 text Custom Parameter limit.
Lack of clear and/or up-to-date documentation
Example 1: Session minimal duration
In Automatically collected events, the session_start event is described as ‘when a user engages the app for more than the minimum session duration after a period of inactivity that exceeds the session timeout duration’, with the default minimum engagement time being 10 seconds.
However, in the Firebase documentation, the setMinimumSessionDuration method is marked as deprecated, no further details can be found regarding whether the 10 seconds still applies to the session_start event.

When testing in App, the session_start fires as soon as the user starts the app (see screenshot below).

As shown in the screenshot below, the web event behaves similarly to the app for session_start event.
When testing on our website, it happens at the same time as the page_view event, typically 3-8 seconds after the initial request being sent. We assume the delay is due to event batching or the asynchronous nature of the requests (no document can be found about what’s causing the delay either). However, the delay is less than 10 seconds during our testing, so unlikely to be the ‘minimal engagement duration’.

Example 2: Web stream number
Usage guides for App + Web properties states ‘you can add only one web stream to a property’. However, this has been updated to ‘App + Web properties now support multiple web streams, including Firebase web apps, in a single property—up to 50 data streams across your apps, websites, and web apps’ based on Google’s What’s new in App + Web properties blog.
Example 3: Stream name Vs Stream ID

In the Google Analytics App + Web ‘Data Streams’ settings, ‘Stream Name’ is a string entered by the user and ‘Stream ID’ is a number generated by Google Analytics.
In the ‘Analysis - Exploration’ report, when selecting ‘Stream name’ as a reporting dimension, the value of a stream ID is shown instead of the stream name.

The name ‘App + Web’ is difficult to search
People have been using different nicknames because the name ‘App + Web’ is confusing and hard to pronounce. Examples of such nicknames are ‘GAv2’, ‘Firebase for Web’ and ‘GA A+W’.
When searching for ‘Google analytics App + Web’, partial match with ‘app’ or ‘web’ makes it difficult to find related results.
No Enhanced Ecommerce GTM Tag or GA reports
Currently, there is no Ecommerce reporting in Google Analytics App + Web.
For passing product arrays (or nested arrays) with Enhanced Ecommerce events, it can only be done through on-page gtag() method. It’s not supported by the GTM method.
Update: Ecommerce (App + Web) Developer Guide for GTM was published last week. Now you can send array items using dataLayer (recommended) or Custom JavaScript Variable methods. We have tested by sending both array parameter ‘items’ and stringified value ‘test_items’ with ecommerce event. Currently, only the string value is showing up in DebugView and Event reports.


Limitations for Parameter Reports
In the ‘Event Parameter’ report, if we want to enable a parameter for a certain event, data has to be collected for this event first. In another word, we need to know when a parameter for an event will be recorded, then add it to the report afterwards. It can also take up to 24 hours for the data to appear in the report.
Each parameter has to be edited individually and it is a time-consuming task.
Another limitation is that App + Web only has hit scope parameters and user properties. The product and session scope parameters in Universal Analytics are not supported by App + Web at the moment.
No direct connection between App + Web and Data Studio
Currently, we can only connect App + Web to Data Studio through BigQuery. The export also requires us to create a dummy app and a firebase project.
Google Analytics reporting interface is not ideal
The UI design is not intuitive. For example, the column widths make it impossible to view the data for some reports.
In the ‘Events’ report, all events are listed alphabetically. We cannot distinguish between auto-collected, recommended or custom events.
Also, it’s not possible to further group the ‘Parameter’ report by a secondary parameter, something we could do using the secondary dimension report in Google Analytics interface.
In the ‘Segment Overlap’ report, you cannot save the segment to be reused in a different report. You can build audiences from the segment but you can’t import those audiences into the report.
App Debug is difficult to use
To enable debug events for iOS apps, we need to have access to the source code/xcode project, or the mobile dev will have to build a special debug version of the app. If the debug version is not 100% identical to the live version, the debug testing result can be invalid.
Delay for debug view events is also quite long. We often see 5-10 seconds delay and sometimes need to refresh the page multiple times to see debug events.
Earlier events can be registered later in debug view and appear after a while. For example, if event_1, event_2 and event_3 happened in order in debug mode. Sometimes we can see event_2 and event_3 appear first in the stream view, then a few seconds later event_1 is added before event_2. If the result is exported before event_1 being added, it will appear as if the event was missing.
The Debug Device selector is hard to use, sometimes it shows all iPhones as ‘apple’. If there are multiple debug devices being connected at the same time, it can be difficult to find your device.
Some GTM features are unavailable in App + Web
Setting global values in the configuration tag in Google Tag Manager does not work. We could only set parameters in each event tag.
Google Tag Manager’s ‘Preview Mode’ to enable debug mode does not work. A parameter ‘debug_mode’ with a value of ‘true’ needs to be added to the Event Tag to enable DebugView. This means we need to have ‘Edit access’ to the Google Tag Manager container to be able to view debug events. Once testing is completed, this parameter needs to be removed.

Summary
Google Analytics App + Web still has a long way to go before becoming a fully functional Analytics Platform. The purpose of this article is not to criticize this still in beta product, but to summarize our team’s findings. We definitely recommend you to try out this new tool in parallel with existing Universal Analytics.